Journal of Chemical Metrology
Year: 2022 Volume: 16 Issue:2 July-December
1) NMR as biphasic pKa measurement technique

NMR is a powerful technique with a wide range of applications, including measurements of acid dissociation constants (pKa values). One such example where NMR is particularly valuable is the measurement of biphasic octanol-water pKa (pKaow) values. Acid-base properties in biphasic systems (extraction systems, lipid bilayers, phase-transfer catalysis systems) are commonly estimated from single-phase (typically aqueous) pKa values. However, acid-base properties in biphasic systems are more complex than in systems consisting of one phase and the single-phase pKa value does not adequately describe the situation. Biphasic pKa values (such as octanol:water biphasic pKa values, pKaow) have been introduced to provide a more realistic description of behaviour acids in biphasic systems. 1H and 13C NMR have been used extensively for pKaow measurements and their advantages and disadvantages have been discussed in detail. However, the suitability of 31P NMR has not yet been assessed in depth and 19F NMR has until now not been used for pKaow measurements at all. In this study, we measure pKaow values with 1H, 13C, 19F and 31P NMR and provide a detailed comparison of NMR with these four nuclei in terms of pKaow measurement.
DOI http://doi.org/10.25135/jcm.79.2211.2639 Keywords NMR acidity lipophilicity biphasic systems partitioning equilibria DETAILS PDF OF ARTICLE © 2022 ACG Publications. All rights reserved.2) Development of ledipasvir and sofosbuvir pure certified reference materials for improving quality of pharmaceutical analysis

The pure materials play a pivotal role in controlling the quality of pharmaceutical products, ensuring comparability and metrological traceability of test results, and performance evaluation of measuring instruments. Herein, the purity characterization of chronic hepatitis C virus sofosbuvir and ledipasvir pharmaceuticals was established based on the assessment of mass fractions of potential impurities in the material including heavy metals, residual solvents, and water content, as well as structurally-related organic impurities. The combined estimate of these impurities by mass balance approach led to indirect purity determination of sofosbuvir and ledipasvir materials. The impurities mass fractions in each material were assigned by validated chromatographic methods, Karl Fisher titrator, and inductively coupled plasma-based method. The certified purity values of sofosbuvir and ledipasvir and their corresponding expanded uncertainties (k =2.0 at 95% CL) were found (99.79±0.03) %, (99.69±0.04) %, respectively. The developed certified reference materials (CRMs) with small uncertainty values will support pharmaceutical testing laboratories in their efforts to maintain and improve the quality of results and provide them with high-order CRMs for the accurate determination of both analytes in raw materials and finished products
DOI http://doi.org/10.25135/jcm.73.2210.2591 Keywords Ledipasvir sofosbuvir value assignment mass balance approach certified reference materials DETAILS PDF OF ARTICLE © 2022 ACG Publications. All rights reserved.3) Development of chemometrics method based on infrared spectroscopy for the determination of cement composition and process optimization

IIn combination with a multivariate calibration method, FTIR-ATR spectroscopy was presented as a rapid method for the determination of some major oxides (CaO, SiO2, Al2O3, Fe2O3) and minor oxides (MgO, SO4, Na2O, and K2O) in diverse materials (raw material, raw meal, additives, clinker, and types of cement) in cement manufacturing. The FTIR spectroscopy based multivariate models were generated by taking X-ray fluorescence (XRF) as a reference method. Among a number of spectral preprocessing methods, extended multiplicative scatter correction (EMSC) yielded the best PLS models. The standard error of prediction (SEP) for the optimal FTIR based PLS models ranged from 0.10 to 2.07 (w/w%), and the regression coefficient (R2) ranged from 0.95 to 0.99 for PLS predicted vs XRF reference plots. Statistical evaluation of the both methods was carried out by paired t-test at the 95% confidence level and the results showed that the FTIR-ATR combined with PLS model results are consistent with the XRF reference measurements for all the oxides studied. Compared to the XRF method, which can take anywhere from a few minutes to an hour for each measurement, the proposed method is faster, cheaper, and safer. The presented technology also allows rapid monitoring of a cement factory production line.
DOI http://doi.org/10.25135/jcm.76.2210.2601 Keywords Cement composition PLS oxide determination FTIR XRF DETAILS PDF OF ARTICLE © 2022 ACG Publications. All rights reserved.4) HPTLC- Densitometric method for assay of chlorthalidone, metoprolol succinate and telmisartan in combined pharmaceutical formulation
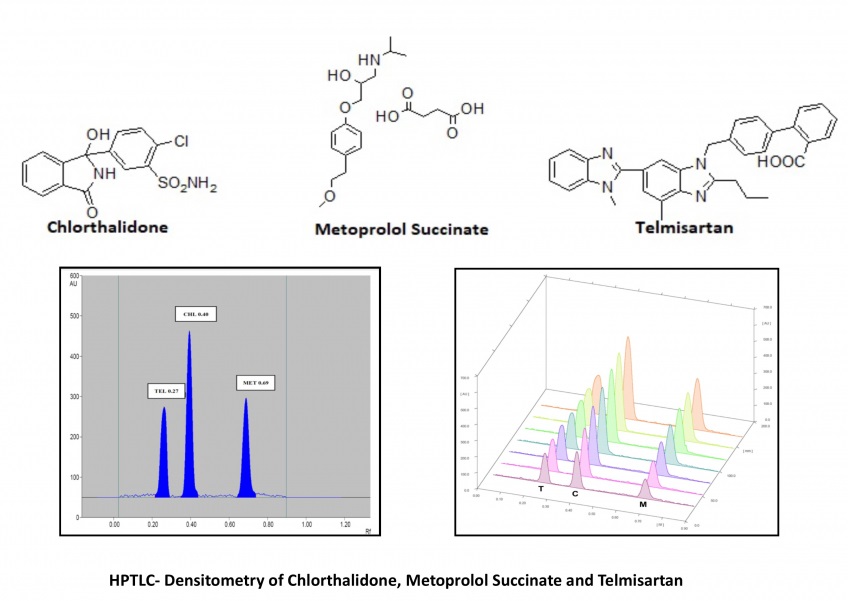
The present study shows the compilation of the results obtained for a very simple, fast and precise high-performance thin-layer chromatography (HPTLC) - densitometric determination of chlorthalidone (CHL), metoprolol succinate (MET) and telmisartan (TEL) in bulk drugs as well as the commercially available formulation. The chromatographic separation of samples was performed on Silica Gel 60 F254 aluminum sheets using Toluene: Methanol: Ethyl acetate: Tri-ethylamine as the mobile phase in the volume ratio 4:0.8:1: 1.2. The densitometric scanning was performed at 225 nm wavelength using CAMAG TLC Scanner- IV. The mentioned chromatographic system showed the compact band and symmetrical peaks of CHL, MET and TEL with 0.40 (±0.2), 0.69 (±0.2) and 0.27 (±0.2) retardation factor (Rf) respectively. The reported method is linear in the concentration range of 500-2000 ng/band, 1000-4000 ng/band and 1600-6400 ng/band while the recovery was found in the range of 98.94-99.62%, 98.26-98.41% and 99.86-100.28% for CHL, MET and TEL respectively. The method assayed the marketed formulation with 99.89 (±0.91) for CHL, 98.92 (±1.07) for MET and 100.12 (±0.65) for TEL concerning the label claim. All the results suggested the agreement of the developed method to the ICH Q2(R1) guidelines and its applicability for day-to-day analysis of these drugs in combined pharmaceutical formulations.
DOI http://doi.org/10.25135/jcm.77.2208.2546 Keywords Analytical method chlorthalidone densitometry HPTLC metoprolol succinate telmisartan DETAILS PDF OF ARTICLE © 2022 ACG Publications. All rights reserved.5) Simultaneous determination of chlorpheniramine maleate, pseudoephedrine hydrochloride, oxolamine citrate and paracetamol by HPLC-PDA in pharmaceutical dosage forms
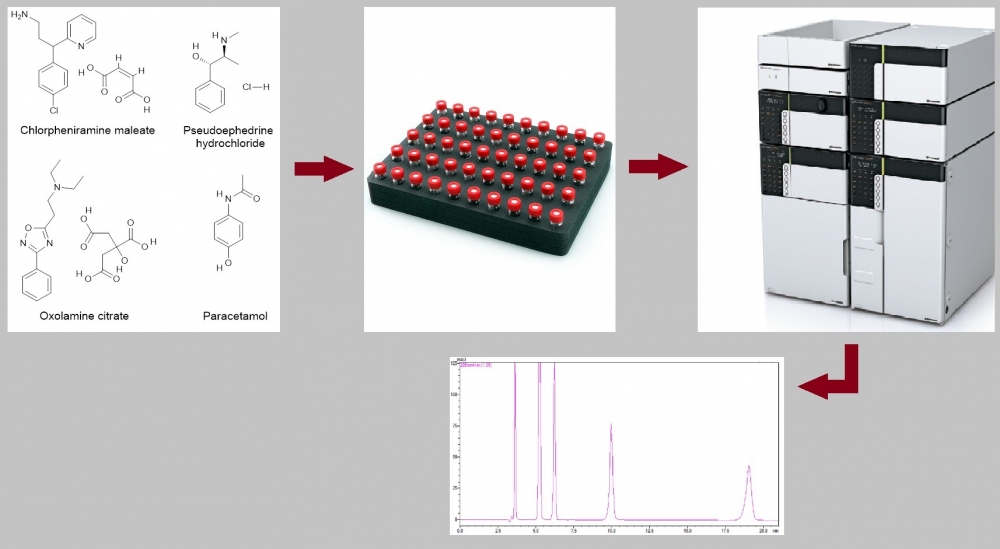
A simple and sensitive method has been developed for the simultaneous determination of chlorpheniramine maleate, pseudoephedrine hydrochloride, oxolamine citrate, and paracetamol by HPLC-PDA in pharmaceutical dosage forms. The separation of the analytes was achieved on an ACE 5 C8, 250 × 4.6 mm, 5 μm column using isocratic elution with a mobile phase containing methanol and 0.1 M phosphoric acid aqueous solution (15:85, v:v) at a flow rate of 1 mL/min. The total run time is 21 min. Chlorpheniramine maleate, pseudoephedrine hydrochloride, oxolamine citrate, and paracetamol were detected at wavelengths (retention times) of 264 nm (9.96 min), 205 nm (6.22 min), 239 nm (19.04 min) and 244 nm (5.22 min), respectively. The injection volume was 10 μL. The assay was in for chlorpheniramine maleate, pseudoephedrine hydrochloride, oxolamine citrate and paracetamol the concentration ranges 32–48 µg/mL, 9.6–14.4 µg/mL, 32–48 µg/mL, 104–156 µg/mL, respectively. LOQs (µg/mL) and LODs (µg/mL) 1.38 and 0.46 for chlorpheniramine maleate, 0.05 and 0.02 for pseudoephedrine hydrochloride, 0.76 and 0.25 for oxolamine citrate, 0.21 and 0.07 for paracetamol, respectively. Recoveries of the analytes were between 98% and 102% with intra-and inter-day precisions (as relative standard deviation) of ≤2%. In addition, expanded uncertainty values were less than 2 for all analytes. Method validation was carried out according to ICH guideline Q2 (R1). The analytical method validated was successfully applied to pharmaceutical dosage forms
DOI http://doi.org/10.25135/jcm.752210.2596 Keywords Chlorpheniramine maleate pseudoephedrine hydrochloride oxolamine citrate paracetamol pharmaceutical dosage forms HPLC-PDA DETAILS PDF OF ARTICLE © 2022 ACG Publications. All rights reserved.6) Validated chromatographic methods for concurrent determination of atorvastatin and perindopril
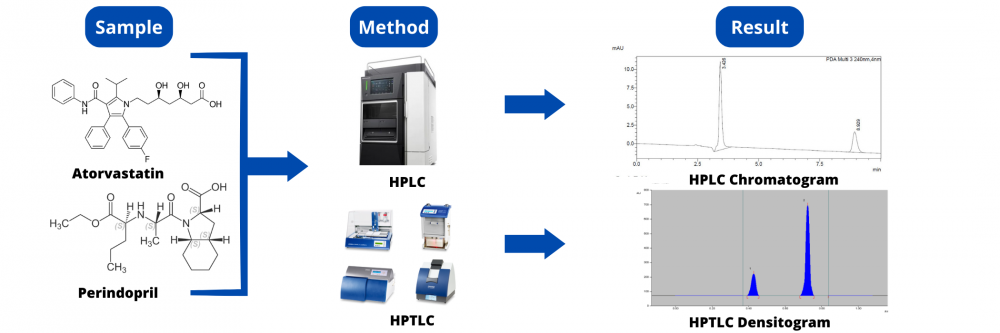
Two simple, selective, precise, and accurate chromatographic methods, namely reversed-phase high-performance liquid chromatography (RP-HPLC) method and High-performance thin-layer chromatography (HPTLC), were developed and validated for the simultaneous determination of Atorvastatin (ATO) and Perindopril (PER). The developed HPTLC method was used for the separation and quantitation of the studied drugs on silica gel 60F254 TLC plates. Dichloromethane: Methanol: Ethyl acetate: Glacial acetic acid (6:2:2:0.1, v/v/v/v) was used as a developing system and the separated bands were UV-scanned at 221 nm. Linear relationships were obtained in the range of 800 – 4800 ng/band for Atorvastatin and 200 – 1200 ng/band for Perindopril with a regression coefficient greater than 0.999. The Rf value of the drug was found to be 0.70 ± 0.02 and 0.39 ± 0.03 for Atorvastatin and Perindopril respectively. The developed RP-HPLC depended on chromatographic separation of the studied drugs on a C18 column using Acetonitrile: Methanol: Potassium dihydrogen orthophosphate (pH 3 adjusted with orthophosphoric acid) ((40:10:50), v/v/v) as a mobile phase delivered at a constant flow rate of 1 mL/min with UV detection at 240 nm. The calibration curves were linear (r2 > 0.999) over the concentration range 20-100 µg/mL for Atorvastatin and 10-50µg/mL for Perindopril. The average retention times for Atorvastatin and Perindopril were 3.42 and 8.92 min, respectively. Factors affecting the developed methods have been studied and optimized. Further, methods validation has been carried out according to ICH guidelines. The proposed methods were successfully applied for the determination of the studied drug simultaneously in bulk and synthetic mixture qualitatively and quantitatively. Statistical analysis by the F test showed no significant difference between the results obtained by the two methods. The uncertainty measurement was also carried out for the quantification of both components. The proposed HPTLC method proved to be more sensitive, while the HPLC gave more reproducible results and was time-saving.
DOI http://doi.org/10.25135/jcm.72.2208.2545 Keywords Atorvastatin perindopril HPLC Method HPTLC Method statistical comparison Method Validation DETAILS PDF OF ARTICLE © 2022 ACG Publications. All rights reserved.7) Development and application of HPTLC method for estimation of Rivaroxaban and Aspirin in bulk drug and in-house tablet form
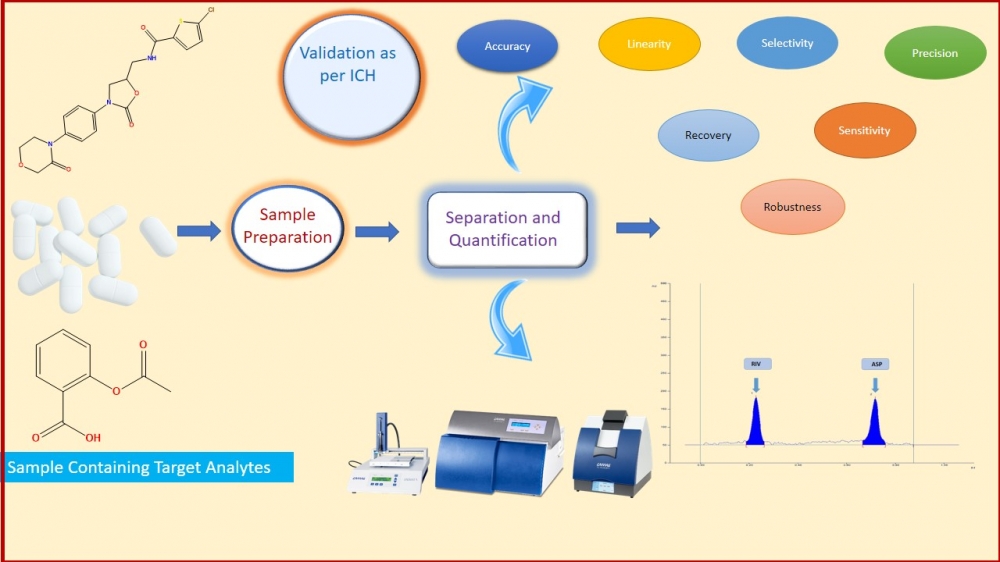
In the present work, simple, precise, accurate high-performance thin-layer chromatography was developed, optimized, and validated for quantitation of Rivaroxaban (RIV) and Aspirin (ASP). The developed method was applied for quantification of both the drugs simultaneously in bulk drug and in-house tablet formulation. In this study, the Camag Linomat V HPTLC system and win CATS software V1.4.7 were used. Both molecules were separated using a chromatographic method consisting of toluene: ethyl acetate: methanol: glacial acetic acid (6:3:0.5:0.5 v/v/v/v) as mobile phase & an aluminum pre-coated plate with silica gel 60 F254 as the stationary phase. Both drugs were detected at 256nm. With Rf values of 0.23 and 0.72, respectively, Rivaroxaban and aspirin were satisfactorily resolved. Moreover, as per the ICHQ2 (R1) guideline, Specificity, precision, accuracy, robustness, linearity, the limit of detection, and the limit of quantification were performed. The method was found linear in the range of 100-400 ng/band and 2000-8000 ng/band of Rivaroxaban and Aspirin, respectively. The precision of the method was determined by %RSD and it was found in range. In-house tablet formulation was prepared and applied the developed method for assay of RIV and ASP. The % Assay (%v/v) of RIV and ASP was found 100.61 %w/w and 100.29 %w/w. In a conclusion, the accurate, precise, sensitive, and robust HPTLC method was optimized, developed, and validated as per ICH Q2 (R1) guideline, which was applied for in-house tablet formulation. The result of the assay suggests that the developed method can be used for simultaneous estimation of RIV and ASP for their dosage form as a part of regulatory submission.
DOI http://doi.org/10.25135/jcm.78.2211.2636 Keywords Rivaroxaban high performance thin layer chromatography validation ICH guidelines tablet formulation. DETAILS PDF OF ARTICLE © 2022 ACG Publications. All rights reserved.8) Determination of some heavy metal deposits in gluten-free foods in Turkish market with ICP-OES
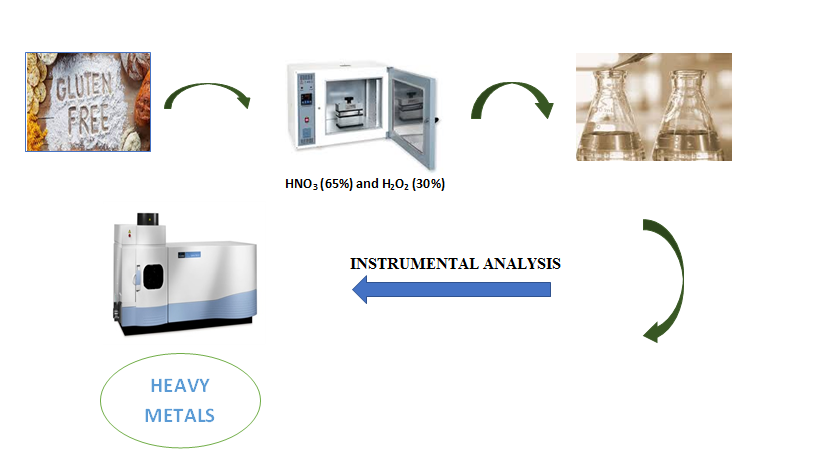
In recent years, celiac disease has become known to the public with the development of medical diagnosis possibilities and increased awareness of the celiac disease. The only cure for celiac disease is a gluten-free diet that must be strictly followed for perpetuity. Food products with gluten content lower than 20 ppm are considered gluten-free products. With the increase in the number of people with celiac disease and people on a gluten-free diet, the amount and variety of gluten-free products have increased significantly. Rice and corn are the raw materials of gluten-free products. However, this situation causes people who follow a gluten-free diet to be exposed to a uniform diet and deficient in the intake of essential elements such as copper, iron, and manganese. In this study, 41 gluten-free products in Turkey were examined with ICP-OES as copper, iron, manganese, zinc, and strontium content, and the results were reported. The samples with the highest Cu concentration were corn and puffed rice at 51.45 mg/kg and vermicelli at 32.40 mg/kg. Chocolate sauce and cornflakes were the samples at 137.43 mg/kg and 117.20 mg/kg, respectively, with the highest Fe concentration. The highest Mn concentration was precooked chickpea flour at 20.80 mg/kg. The highest strontium concentration value was 12.85 mg/kg in carob flour. The samples with the highest Zn concentration were determined in yeast at 91.98 mg/kg and pistachio croquant at 85.50 mg/kg.
DOI http://doi.org/10.25135/jcm.74.2209.2678 Keywords Celiac disease essential elements gluten gluten-free diet DETAILS PDF OF ARTICLE © 2022 ACG Publications. All rights reserved.9) Phenolic compounds from section Majorana (Mill.) Benth of Origanum L. species extracts via validated LC-MS/MS method
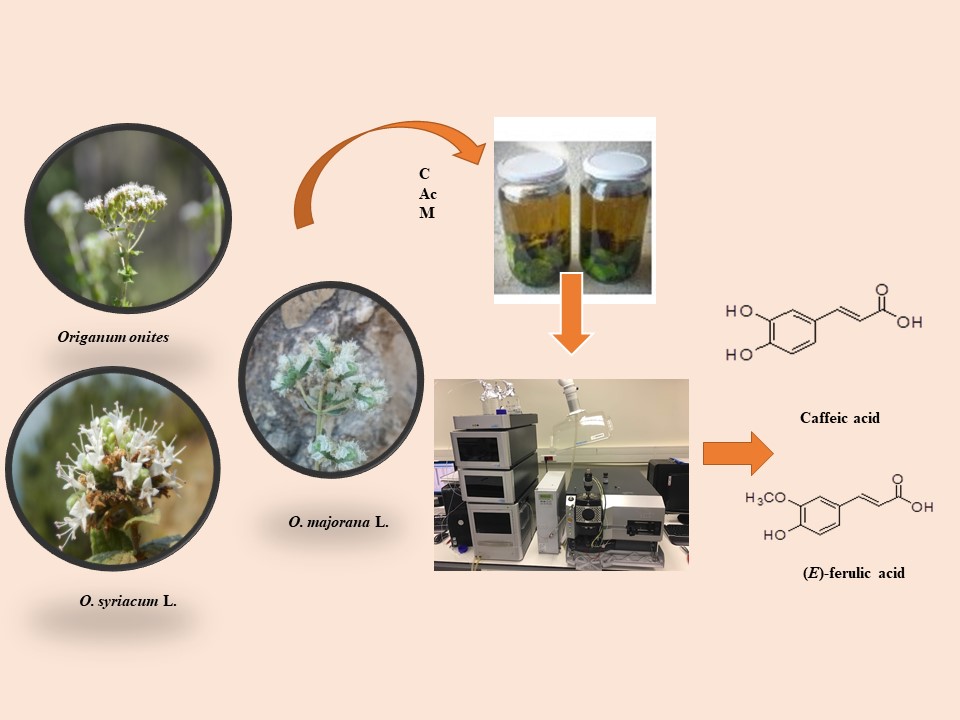
Origanum majorana L., (OM), O. onites L. (OO) and O. syriacum L. (subsp. bevanii (Holmes) Greuter & Burdet) (OS) are belong to Majorana (Mill.) Benth. section of Origanum L. genus. In this study, quantities of some phenolic compounds; gallic acid, syringic acid, p-hydory benzoic acid, caffeic acid, (E)-ferulic acid, chlorogenic acid, rosmarinic acid, pyrogallol and vanillin; in the chloroform (C), acetone (Ac) and methanol (M) extracts prepared from Origanum species collected from Türkiye were investigated via liquid chromatography and tandem mass spectrometry (LC-MS/MS). The relative standard deviations (RSD) of the phenolics were found as follows; 4.85, 8.39, 4.78, 8.04, 5.21, 5.45, 3.73, 5.47, respectively. Curcumin was used as an internal standard (RSD was 6.57). In the extracts, (E)-ferulic acid and caffeic acid found to be the most abundant compounds. OS was determined as the richest species in terms of phenolic acids. For the investigated analytes, the correlation coefficient was found in the range of 0.9803 to 0.9982.
DOI http://doi.org/10.25135/jcm.80.2211.2667 Keywords Origanum section Majorana (Mill.) Benth. Origanum majorana L.. O. onites L. O. syriacum L. LC-MS/MS. DETAILS PDF OF ARTICLE © 2022 ACG Publications. All rights reserved.