Journal of Chemical Metrology
Year: 2023 Volume: 17 Issue:1 January-June
1) Assessment of uncertainty estimation for measurement of ethanol concentration in COVID-19 hand sanitizer using FTIR spectroscopy
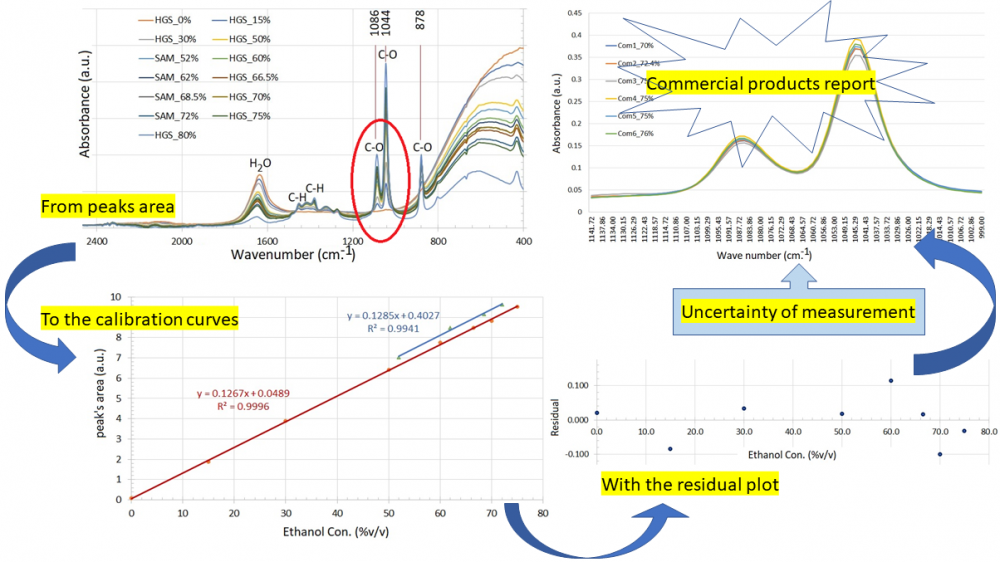
Analysis of uncertainty estimation for measurement of type and concentration of alcohol in hand sanitisers is a matter of urgency in the CoVid-19 situation. FTIR spectroscopy was used to investigate hand sanitisers made in our laboratory and commercial products. An internal standard addition method was used to control the measurement quality. The absorption spectra of ethanol were found to be at 1086 and 1044 cm−1, corresponding to C-O stretching. The area under the C-O adsorptions is used to create a calibration curve, which is then used to calculate the ethanol percentage. Additional standard sample and quality control sample showed calibration curves with slopes of 0.1267 and 0.1285, respectively. The regression coefficients and residual variance of 0.0057 showed a ‘best fit’ with the predicted value. These parameters were used to estimate the uncertainty of six commercial products. The ethanol concentration of commercial products is measured between 71.38 and 81.54% v/v, with an estimated uncertainty of 1.14% v/v. The results showed that the ethanol content of all products differed from the label but could be used to kill bacteria and viruses. This entire process was established as a SOP for measuring alcohol concentration in hand sanitiser.
DOI http://doi.org/10.25135/jcm.81.2210.2611 Keywords COVID-19 pandemic alcohol concentration hand Sanitiser ISO/IEC 17025 uncertainty estimation FTIR spectroscopy DETAILS PDF OF ARTICLE © 2023 ACG Publications. All rights reserved.2) Simultaneous estimation of remogliflozin etabonate and vildagliptin in a tablet formulation: UV spectrophotometric and HPLC-PDA method
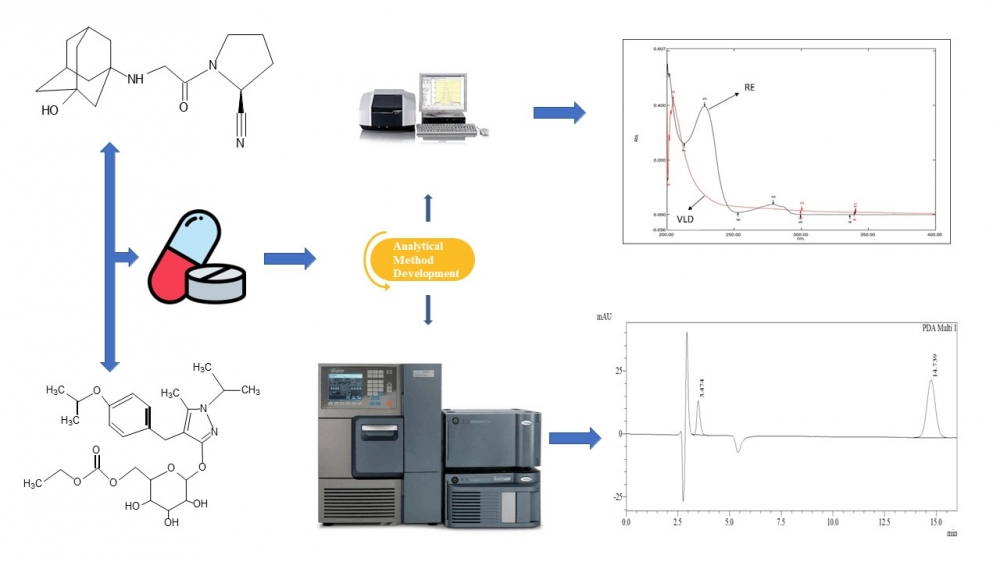
The ultraviolet spectrophotometric and reversed-phase high-performance liquid chromatography methods were developed and validated to quantify remogliflozin etabonate and vildagliptin in a fixed-dose tablet formulation. The materials and methods used in this study involved using methanol as the solvent in developing three ultraviolet spectrophotometric techniques, namely simultaneous equation, absorption ratio, and derivative spectroscopy. The wavelength maxima for vildagliptin and remogliflozin etabonate were determined to be 232 nm and 217 nm, respectively. The chromatographic method involved using a Phenomenex Luna C18 column (250 × 4.6 mm, 5 µm) and a mobile phase consisting of a mixture of methanol and acetate buffer (pH 5.6) in a 70:30 ratio. The flow rate was set at 1 mL/min, and the detecting wavelength was 210 nm. The results obtained from the optimized approaches met the performance test criteria set by the International Conference on Harmonization guideline Q2 (R1). The methods were then applied to assay marketed tablet formulations, and the results obtained were within acceptable limits. In conclusion, the developed techniques can be used to analyze the fixed-dose tablet formulation regularly
DOI http://doi.org/10.25135/jcm.82.2301.2693 Keywords FDC Remogliflozin Etabonate HPLC-PDA T2DM vildagliptin DETAILS PDF OF ARTICLE © 2023 ACG Publications. All rights reserved.3) DNA quantification via nanodrop spectrophotometer: estimation of method uncertainty using DNA from standard reference materials, sprague dawley rats, and humans
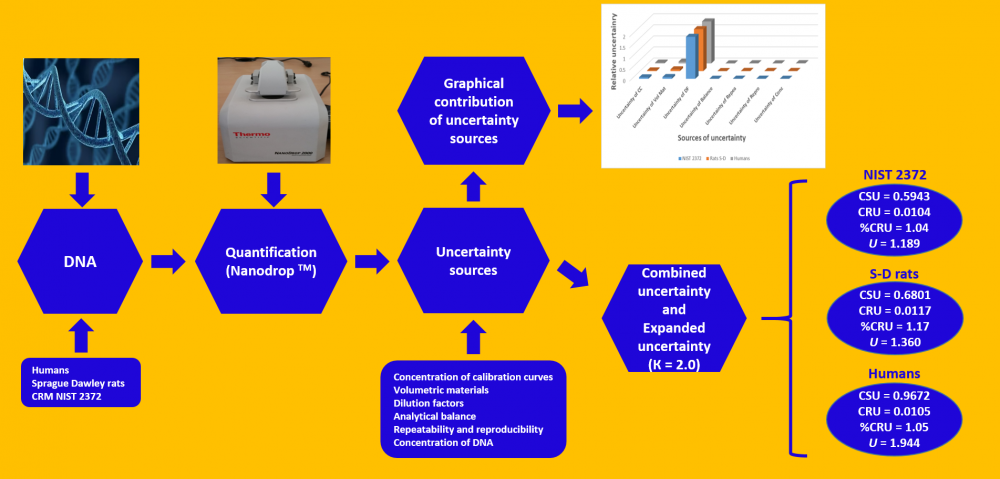
Although the uncertainty calculation proposed by ISO was initially applied to physical quantities, it now also applies to chemical measurements. Therefore, uncertainty estimation contributes to the reliability of the results obtained in analytical chemical measurements, among other parameters. This work seeks to estimate the uncertainty of the analytical method for DNA quantification through a Nanodrop spectrophotometer, using DNA from certified reference materials (NIST 2372), Sprague Dawley rats, and humans. For these purposes, the sources of uncertainty were established and evaluated. Some of these sources are concentration uncertainty from the calibration curves, volumetric materials, dilution factors, analytical balance, repeatability, and reproducibility, as well as DNA concentrations used. The results obtained indicate that the expanded uncertainty was 1.189, 1.360, and 1.944 ng/µL of DNA for the reference material (NIST 2372), Sprague Dawley rats, and humans, thus representing 2.08%, 2.34%, and 2.12%, respectively, for the DNA concentrations from each source (57.0, 57.9, and 91.5 ng/µL DNA, respectively). The uncertainty source that contributes most to these calculations is the dilution factor uncertainty, although it should be noted that the dilution factor uncertainty also considers the volumetric material uncertainty, as well as the fact that five dilutions were used for the calibration curves. Hence, these results may be overestimated.
DOI http://doi.org/10.25135/jcm.83.2301.2676 Keywords DNA Nanodrop spectrophotometer Uncertainty DETAILS PDF OF ARTICLE © 2023 ACG Publications. All rights reserved.4) Chemometrics assisted UV-spectrophotometric method for simultaneous estimation of aliskiren and hydrochlorothiazide in bulk and their pharmaceutical dosage form
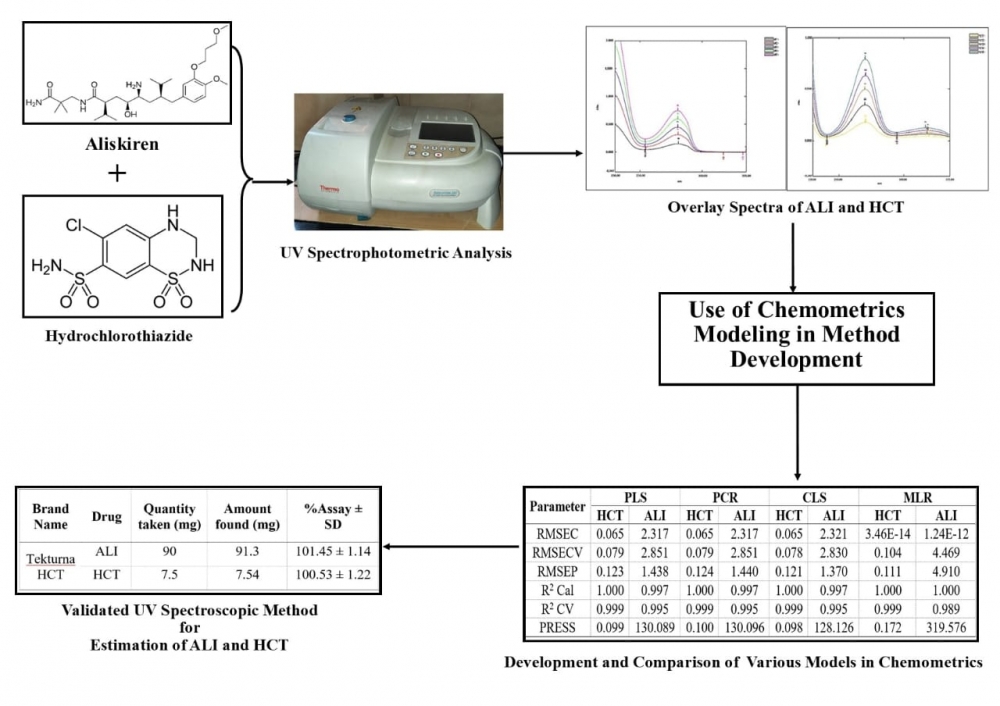
Aim of present research work was to develop and validate chemometrics assisted UV spectrophotometric method for simultaneous estimation of aliskiren and hydrochlorothiazide in bulk and their pharmaceutical dosage form. A five level two factor (2 Drugs) design was applied to get the 25 combinations of mixtures to be prepared. 16 set of mixtures were used for calibration and 9 set of mixtures were used for validation in wavelength range of 231-334 nm (wavelength interval λ=1 nm) in methanol. Various models like Classical Least Square (CLS), Multiple Linear Regression (MLR), Principal Component Regression (PCR) and Partial Least Square (PLS) were applied to the absorbance data obtained and among which CLS model was found to be best suited. Beer’s law was obeyed in concentration range 30 to 150 µg/mL for aliskiren and 2.5 to 12.5 µg/mL for hydrochlorothiazide. The method was then validated according to International Conference on Harmonization ICH Q2 (R1) and was found to be advantageous in terms of novelty and simplicity.
DOI http://doi.org/10.25135/rnp.84.2212.2661 Keywords Chemometrics Aliskiren Hydrochlorothiazide Classical Least Square Inverse least squares Principal Component Regression DETAILS PDF OF ARTICLE © 2023 ACG Publications. All rights reserved.5) 1H NMR spectroscopy-based serum metabolomics analysis of iron deficiency anemia
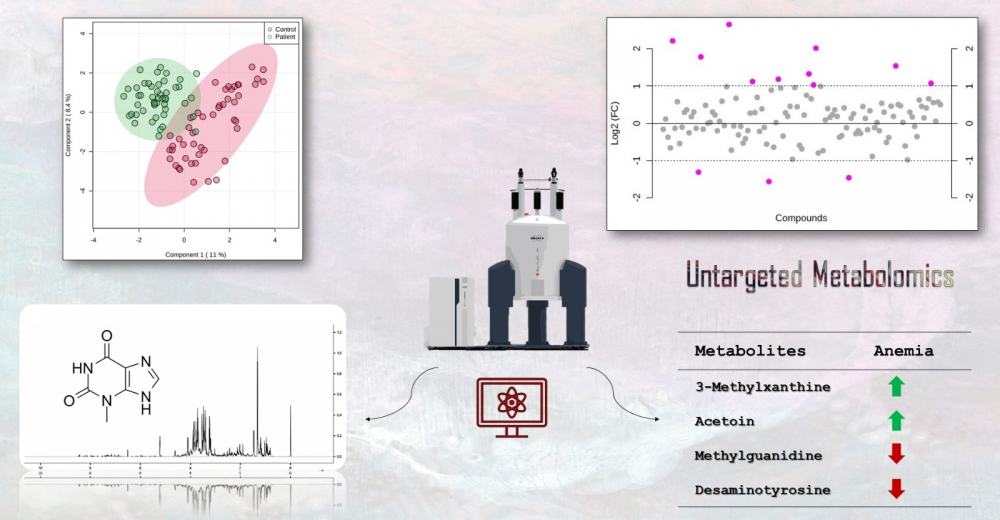
Iron deficiency anemia is a prevalent type of anemia globally, caused mainly by the deficiency of iron, which is an essential component of various metabolic pathways. In this study, we aimed to investigate the changes in metabolite profiles resulting from alterations in these interconnected pathways. We selected 48 patients with IDA and 48 healthy participants based on diagnostic criteria for iron deficiency. NMR spectroscopy was utilized for metabolite profiling. Chenomx, MetaboAnalyst, and R were employed for data analysis. NMR analysis identified and quantified 119 metabolites. Significant metabolites between the two groups were determined using fold change (FC) analysis and t-test results. The FC values of the metabolite group ranked the following compounds in descending order: Acetoin, 2-Hydroxy-3-methylvalerate, Homogentisate, 3-Methylxanthine, Desaminotyrosine, Succinate, Methylguanidine, Guanidinosuccinate, 3-Methylglutarate, Ethanol, Carnosine, SN-Glycero-3-phosphocholine, and Homocysteine. The IDA patients had increased levels of Acetoin, 2-Hydroxy-3-methylvalerate, Homogentisate, 3-Methylxanthine, Succinate, Guanidinosuccinate, Ethanol, Carnosine, and SN-Glycero-3-phosphocholine, while decreased levels of Desaminotyrosine, Methylguanidine, and 3-Methylglutarate were observed. Our findings provide valuable insights into the different metabolites and pathways associated with IDA. Further molecular research is needed to validate these findings.
DOI http://doi.org/10.25135/jcm.85.2303.2727 Keywords Iron deficiency anemia metabolomics nuclear magnetic resonance metabolites 3-Methylxanthine DETAILS PDF OF ARTICLE © 2023 ACG Publications. All rights reserved.6) Application of the localized surface plasmon resonance of silver nanoparticles for the determination of ethion in water samples
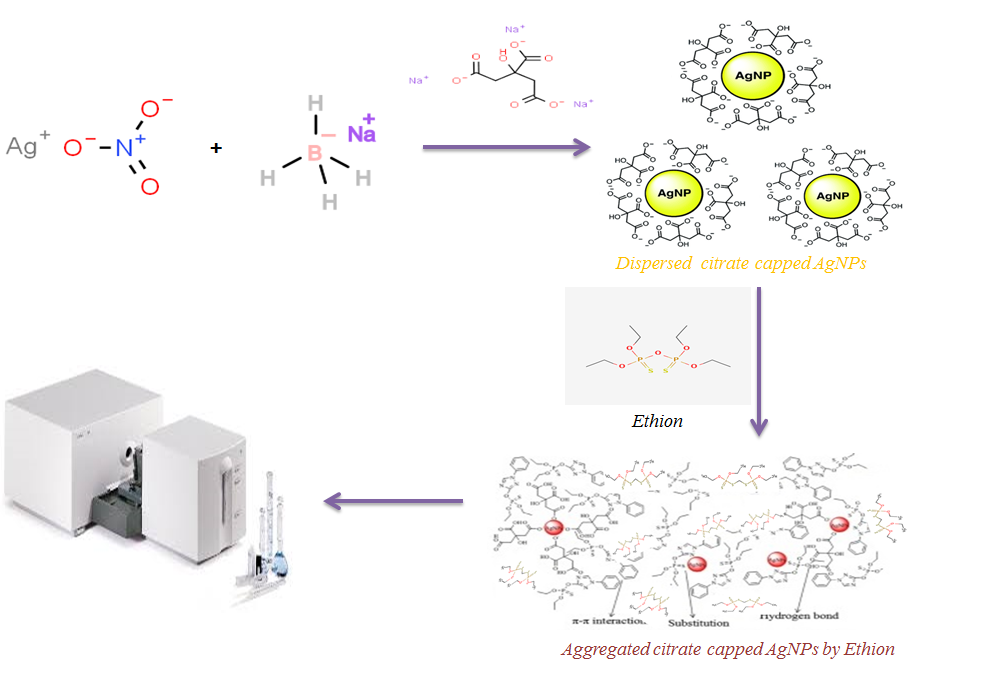
Identification and measurement of pesticides in water is one of the significant public benefits of protecting humans from the effects of water pollution. In this study, a new method was presented for the determination of ethion (ET) as an organophosphate insecticide in water samples based on the use of localized surface plasmon resonance (LSPR) of citrate-capped silver nanoparticles (CC-Ag NPs). The LSPR band was scanned by UV-Visible spectrometer and transmission electron microscopy (TEM) was used to show the interaction, surface features and particle size. By placing CC-Ag NPs in the vicinity of ET, it was observed that the pollutant was adsorbed by silver nanoparticles in aqueous solution. As a result of the adsorption process, aggregation of silver nanoparticles was observed. On the other hand, it was also observed that the ET concentration had a direct effect on the color of the mixture from light yellow to brown. As a result of the aggregation of silver nanoparticles, the adsorption peak in the range of 393 nm was reduced and a new adsorption peak was observed in the wavelength of 540 nm. The absorbance ratio at the wavelength of 540 to 393 nm (A540/A393) was used as the analytical signal. The shift in wavelength and the change in adsorption intensity were the expression of the characteristics of the structure and concentration of the pesticide, respectively. The interaction between the sensor and the pesticide was considered to be the result of the binding of the soft metal surface with the soft sulfur atom of the pesticide. Factors affecting adsorption efficiency were investigated including pH, ionic strength, reaction time and sodium citrate concentration. The proposed method had good repeatability, reproducibility and stability. Finally, the applicability of the proposed method for real sample analysis was examined, which was consistent with the obtained experimental results
DOI http://doi.org/10.25135/jcm.86.2303.2728 Keywords Ethion insecticide colorimetric sensor silver nanoparticles; localized surface plasmon resonance DETAILS PDF OF ARTICLE © 2023 ACG Publications. All rights reserved.7) Development of a stability-indicating HPLC method for Lasmiditan and its process related impurities with characterization of degradation products by LCMS/MS
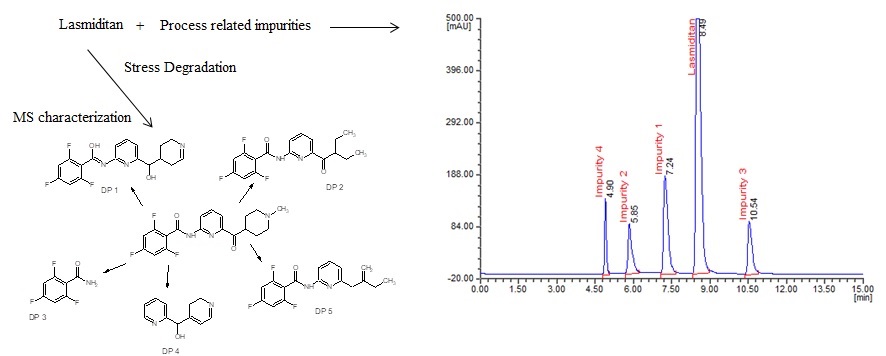
The present investigation aimed to investigate a novel approach involving the utility of liquid chromatography (LC) and liquid chromatography-mass spectrometry (LC–MS) to resolve, identify and characterize very nominal quantities of degradation products (DPs) of lasmiditan without isolation from their reaction mixtures. The process related impurities along with lasmiditan were resolved on Inertsil ODS-3 (250×4.6 mm, 5.0 μm) column at room temperature using 0.1 M phosphate buffer with pH 3.6 and acetonitrile 65:35 (v/v) as mobile phase A, 0.1 M phosphate buffer with pH 3.6 and methanol in the ratio of 20:80 (v/v) as mobile phase B. The mobile phase solvent A and B were mixed at 50:50 (v/v) and the mixture was pumped isocratically at 1.0 mL/min and UV detection at 246 nm. The method shows sensitive detection limit of 0.003 µg/mL, 0.008 µg/mL, 0.008 µg/mL and 0.005 µg/mL respectively for impurity 1, 2, 3 and 4 with calibration curve liner in the range of 25-150 µg/mL and 0.025-0.15 respectively for lasmiditan and its studied impurities. The validation including system suitability, specificity, accuracy, recovery, ruggedness and robustness were noticed to be acceptable. The lasmiditan pure compound was subjected to stress studies as per International Conference on Harmonization (ICH) guideline. Among all the stress conditions the drug was found to be labile in acid, base and UV light conditions, while it was stable in thernak abd peroxide conditions. A total of five degradation products (DPs) were formed. All the DPs were characterized with the help of their fragmentation pattern and the masses obtained upon LC–MS/MS. All the hitherto unknown degradation products were identified 2,4,6-trifluoro-N-{6-[hydroxy(2,3,4,5-tetrahydropyridin-4-yl)methyl]pyridin-2-l}benzenecarboximidic acid (DP 1), N-[6-(2-ethylbutanoyl)pyridin-2-yl]-2,4,6-trifluorobenzamide (DP 2), 2,4,6-trifluorobenzamide (DP 3), 2,3-dihydropyridin-4-yl(pyridin-2-yl)methanol (DP 4) and 2,4,6-trifluoro-N-[6-(2-methylidenebutyl) pyridin-2-yl]benzamide (DP 5). The proposed method was successfully applicable for routine analysis of lasmiditan and its process related impurities in pure drug and formulations and also applicable for identification of known and unknown impurities of lasmiditan.
DOI http://doi.org/10.25135/jcm.89.2304.2767 Keywords Lasmiditan Impurities HPLC method stress degradation studies LCMS characterization degradation products DETAILS PDF OF ARTICLE © 2023 ACG Publications. All rights reserved.8) Determination of adulteration in hair serums by LC-HRMS §
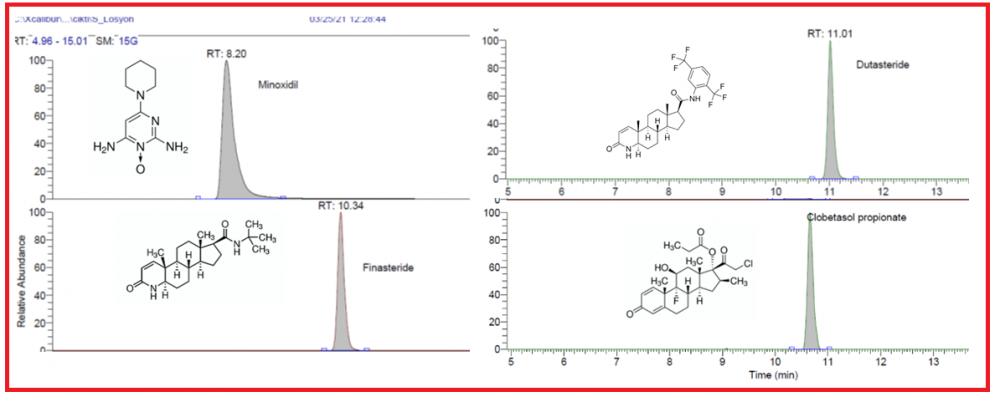
Minoxidil, finasteride, dutasteride, and clobetasol propionate might be present as adulteration agents in cosmetic products such as hair serums. In this study, minoxidil, finasteride, dutasteride, and clobetasol propionate in commercial hair serum samples are determined by an LC-HRMS method. The relative standard deviations (R.S.D.) were below 1.5% for the compounds. The correlation coefficient was determined in the range of 0.997-0.999 for each component in the calibration range. The recoveries of the method are determined as 97.5, 105.5, 104.2, and 100.8, respectively. These active pharmaceutical ingredients were not declared by the manufacturer, however, pose risk to public health due to their potential toxicological properties. The manufacturers and government authorities must be aware and give importance to inform the users to prevent the possible risks.
DOI http://doi.org/10.25135/jcm.90.2304.2599 Keywords Minoxidil finasteride dutasteride clobetasol propionate hair serum toxicology DETAILS PDF OF ARTICLE © 2023 ACG Publications. All rights reserved.9) Certification of buffer solutions reference materials using Baucke cell for supporting the quality of pH measurements
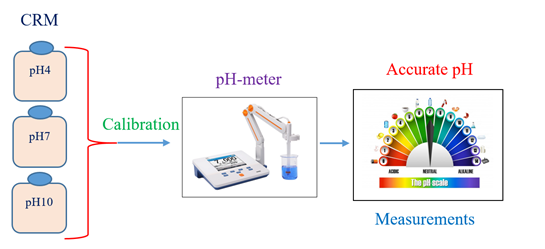
The need for certified pH reference materials to support the traceability claims and quality of the daily large volume of pH measurements is very strong. In this work, three batches of buffer solutions were prepared, and their pH values were certified in accordance with the IUPAC Recommendation 2002. The first batch was prepared from potassium tetraoxalate (dihydrate) and disodium oxalate to provide pH4 and the second batch was prepared from disodium hydrogen phosphate and potassium dihydrogen phosphate to provide pH7. The third batch was prepared from sodium hydrogen carbonate and sodium carbonate to provide pH10. Every batch was homogenized by mechanical shaking for one night and bottled into 50 HDPE bottles, each is 250 mL. A number of bottles were systematically selected for homogeneity, stability and characterization studies of the buffer reference materials. These studies were carried out in accordance with the requirements of ISO 17034 and ISO Guide 35 using Baucke cell. The pH values 4, 7 and 10 of the secondary buffers were restandardized with regard to the pH values 4, 7 and 10 of the primary buffers produced by the Slovak National Metrology Institute, SMU. The results obtained showed that the produced buffer RMs were homogeneous and stable enough and their certified pH values were found 4.001±0.019, 7.005±0.015 and 10.002±0.023. These CRMs will be very useful as calibrants and as PT samples for analytical laboratories performing pH measurements in various fields.
DOI http://doi.org/10.25135/jcm.87.2303.2773 Keywords Buffer batch homogeneity stability Baucke cell characterization uncertainty DETAILS PDF OF ARTICLE © 2023 ACG Publications. All rights reserved.10) Accuracy of quantitative NMR analysis: a case study of lignin
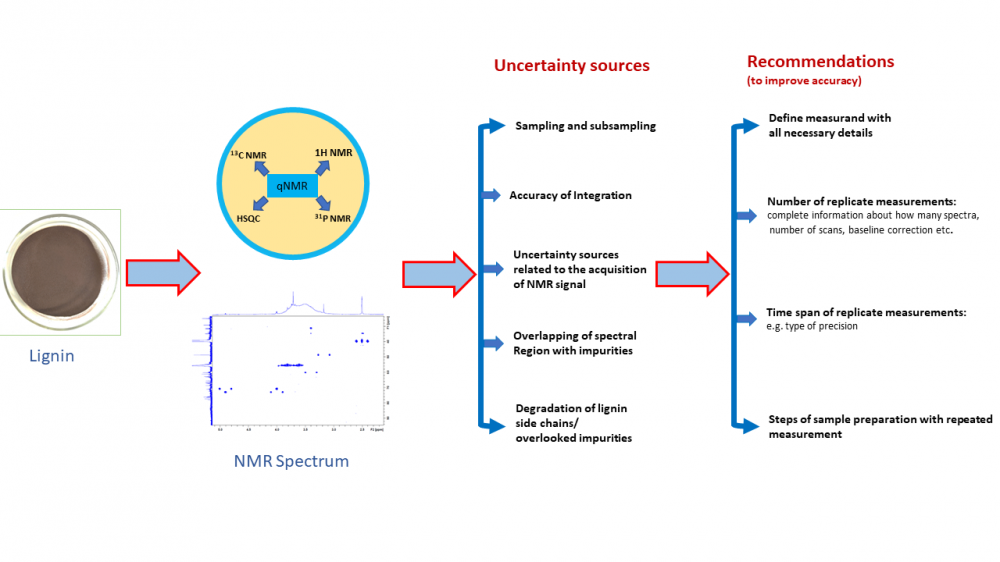
Lignin analysis using quantitative NMR (qNMR) has received a lot of attention recently and has been the topic of a large number of papers. The large majority of them report high-quality research. However, when trying to understand what is the accuracy that can be achieved with such analysis and which of the approaches are more accurate, it turns out that it is difficult to impossible to compare the accuracy of the methods. The main reasons are that different authors use (1) different types of lignin, (2) different measurands and (3) different ways of presenting precision and trueness data. Precision is mostly presented as standard deviation between replicate measurement results but it is in most cases not specified whether the precision relates to repeatability, intermediate precision or some other precision type. Bias is typically termed as “error” and usually expressed as difference from a reference value obtained from an artificial model system or difference from results of independent measurements. Again, insufficient detail is often given. Accuracy in terms of “measurement uncertainty” is hardly ever presented. Some uncertainty sources, most notably variability between subsamples of the same bulk of lignin, are only seldom addressed. We present an analysis of the situation on the basis of 21 papers and give some recommendations for future workers in the field. We hope that this work will be useful for researchers using qNMR for the analysis of lignin, as well as using qNMR for the analysis of natural products more generally.
DOI http://doi.org/10.25135/jcm.88.2304.2753 Keywords Lignin Precision Bias Accuracy NMR qNMR DETAILS PDF OF ARTICLE © 2023 ACG Publications. All rights reserved.